Steering and indicatorsYou run your company without a clear view of how it is performing?
The figures exist, but they are scattered: a spreadsheet per department, an invoicing package, a till system, reports pieced together by hand every month. When a question comes up, the answer arrives too late, or differs depending on the source. Kopus helps you define the indicators that matter, connect your data and build a reliable view, read every week rather than produced once a year.
From scattering to one sheetFrom scattered figures to one sheet read every week
The same word often covers three realities: the revenue in the sales spreadsheet, the one in the invoicing system and the one in the till never quite match. The steering view therefore starts with a written vocabulary and one reference source per piece of data, then with connections that feed the sheet without re-keying. The values are deliberately left empty here: the indicators are chosen from your decisions, not from a template.
The existing sources, kept
Spreadsheets per team
quotes, follow-ups, schedules
its own definition“revenue” = signed quotes
Automatic extraction
Invoicing
invoices, credit notes, payments
its own definition“revenue” = invoiced, net of tax
Connection between tools
Till
the day’s takings
its own definition“revenue” = cashed, incl. tax
Connection between tools
Incoming documents
supplier invoices, delivery notes
its own definitionno definition: paper
Documents read and structured
Shared definitions, one reference source per piece of data
- Revenueinvoiced net of tax, credit notes deductedreference : Invoicing
- Active customerat least one order over the reference periodreference : Invoicing
- Pending quotessent, neither signed nor declinedreference : Sales spreadsheet
Steering sheetread every week
IndicatorValueThreshold and action
- value to be filled in
Revenue for the month
Owner : ManagementDef. writtenweekly
below target at mid-monthreview the follow-up plan
- value to be filled in
Quotes awaiting an answer
Owner : Head of salesDef. writtenweekly
beyond the usual delayfollow up
- value to be filled in
Late payments
Owner : AdministrationDef. writtenweekly
beyond the agreed thresholdpersonalised reminder
- value to be filled in
Active customers
Owner : ManagementDef. writtenmonthly
down two months in a rowreactivation campaign
One shared view, at each level of detail
- Managementthe overall view
- Activity leadstheir scope
- Field teamstheir operations
What we seeThe problem is not a lack of data, but how scattered it is
Most companies have more figures than they use. But each tool produces its own, with its own definitions, and nobody knows which one is the reference. Monthly reporting becomes a manual reconciliation job, fragile and time-consuming, whose conclusions arrive after the decisions have been made.
Before building a dashboard, you need to agree on what should be measured, why, and which source is authoritative for each piece of data.
Our approachDefine the indicators that change a decision
We start from your recurring decisions: hiring, buying, chasing, launching, stopping. For each one, we identify the information that would make it safer, then the indicator that expresses it most simply. A good indicator has an owner, a written definition, a reading frequency and a threshold that triggers an action.
This step, often carried out as part of an audit, avoids decorative dashboards: lots of curves, few decisions.
How we workConnect the data rather than re-key it
Once the indicators are chosen, we look at where the data lives and how to make it flow: a connection between your tools, automatic extraction, or an internal tool that consolidates and presents the information. Documents that arrive as invoices, delivery notes or reports can be read and structured by suitable processing.
The dashboard is only the visible part: its reliability rests on the quality of the sources and on the consolidation rules defined beforehand.
What you gainA shared view, read regularly
The result is an up-to-date view, understandable by the people who decide, with the level of detail suited to each of them: management, heads of activity, the field. Gaps show up early, and discussions are about causes rather than about whether the figures are valid.
We also help you set up a reading routine: an indicator nobody looks at is of no use, whatever its quality.
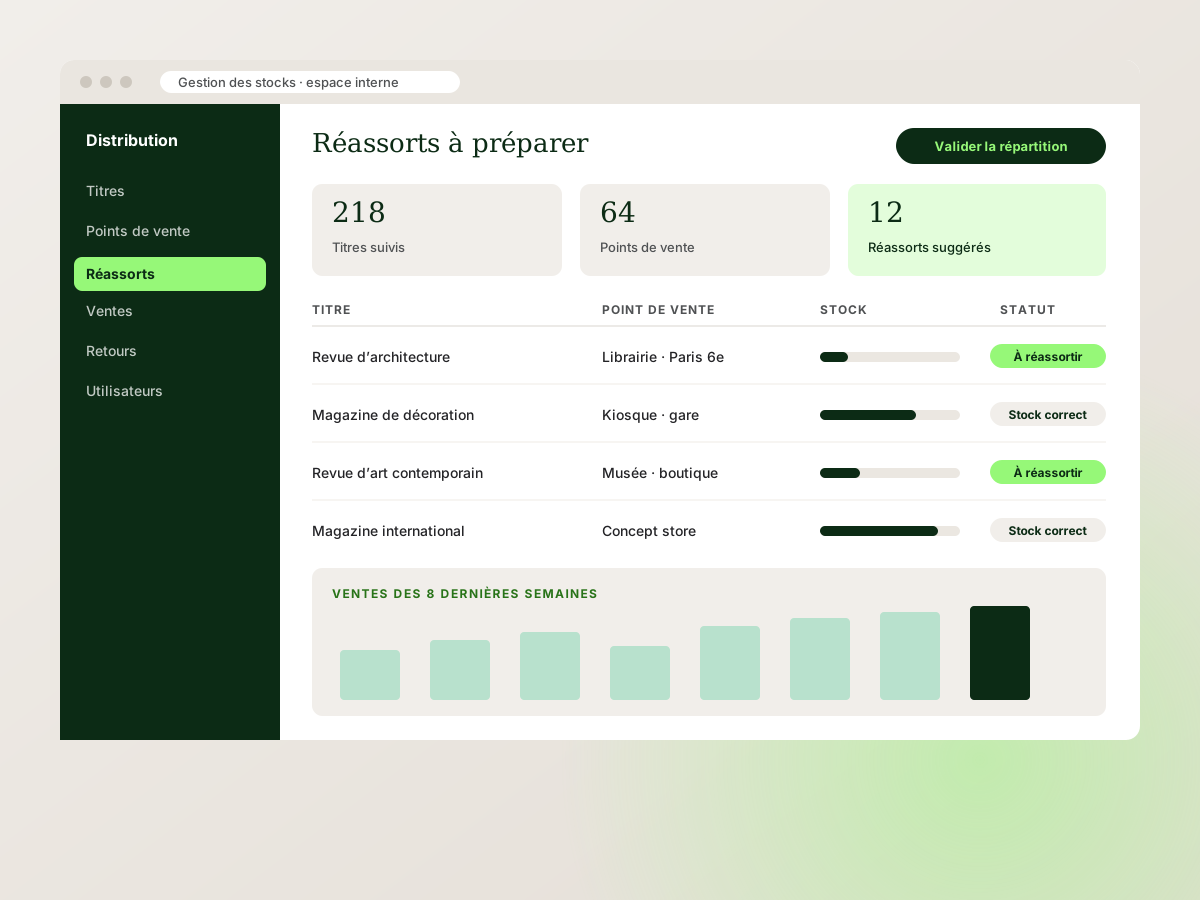 Business software
IPS Diffusion, an internal stock management interface
See the projectProjectProject: IPS Diffusion, seeing sales and stock outlet by outlet
For IPS Diffusion, a specialist press distributor, Kopus designed an internal application that tracks titles, stock, sales and restocking point of sale by point of sale. Information that used to require manual reconciliation became a single view, consulted daily to decide on restocking.
Your questionsFrequently asked questions
Ask a questionHow many indicators should we track?
Few. A handful of indicators tied to real decisions is worth more than an exhaustive table. Other measures can exist in detail, but the steering view stays short.
Do we need to change our software?
Rarely. In most cases, the tools in place stay, and we connect their data. A replacement is only considered if a tool allows no reliable exchange at all.
Isn’t a spreadsheet enough?
It can be, at first. It becomes fragile as soon as several people feed it, the sources multiply or input errors become costly. We suggest a dedicated tool when the spreadsheet reaches its limits, not before.
How long does it take to get a first view?
It depends on the number of sources and how accessible they are. We often start with a limited, reliable view of the two or three priority indicators, then widen it.
Related servicesThe services that address this challenge
- 01 · ConsultingBusiness auditBefore changing anything, understand what is really going on. A Kopus audit gives you a clear, candid reading of your company: what works, what holds you back, and where to start.
- 03 · Web & softwareCustom business softwareInternal tools are rarely spectacular, but they are what saves every employee an hour a day. We design them with the people who will use them, so they are adopted from the first week.
- 03 · Web & softwareAPI integrationYour tools are fine; what is missing is that they talk to each other. We build the connections that move information automatically, with no re-entry, no omission, no spreadsheet in between.
- 04 · AI & automationDocument AI and processingInvoices, contracts, quotes, correspondence, forms: your teams spend hours reading and re-entering. We put AI to work on these document flows, with a level of control suited to each type of document.
- 03 · Web & softwareWeb application developmentWhen a spreadsheet is no longer enough and no off-the-shelf software fits the way you work, a custom web application becomes the right tool. We design it with your users, for your real workflows.
Your challengesRelated challenges
My tools don’t talk to each other
Stop your teams re-entering the same data in several applications.
Explore this challenge Your challenges · 04My company is growing and my organisation can’t keep up
Structure your processes and tools to support your growth.
Explore this challenge Your challenges · 05I want to automate repetitive tasks
Free up time by simplifying repetitive, predictable operations.
Explore this challengeLet’s bring your projects to life
Decide on the basis of figures everyone shares.
Describe the decisions you make blind, or too late, and the tools where your data lives. We will propose a first steering view.